Documents
Welcome to the TransAtlantic Safety Technical Guidance section. We are constantly developing our skill set and knowledge to keep us at the top of our profession and we feel knowledge should be communal. Feel free to download and distribute as you wish, this section shall be replenished with technical guidance on a near-constant basis.
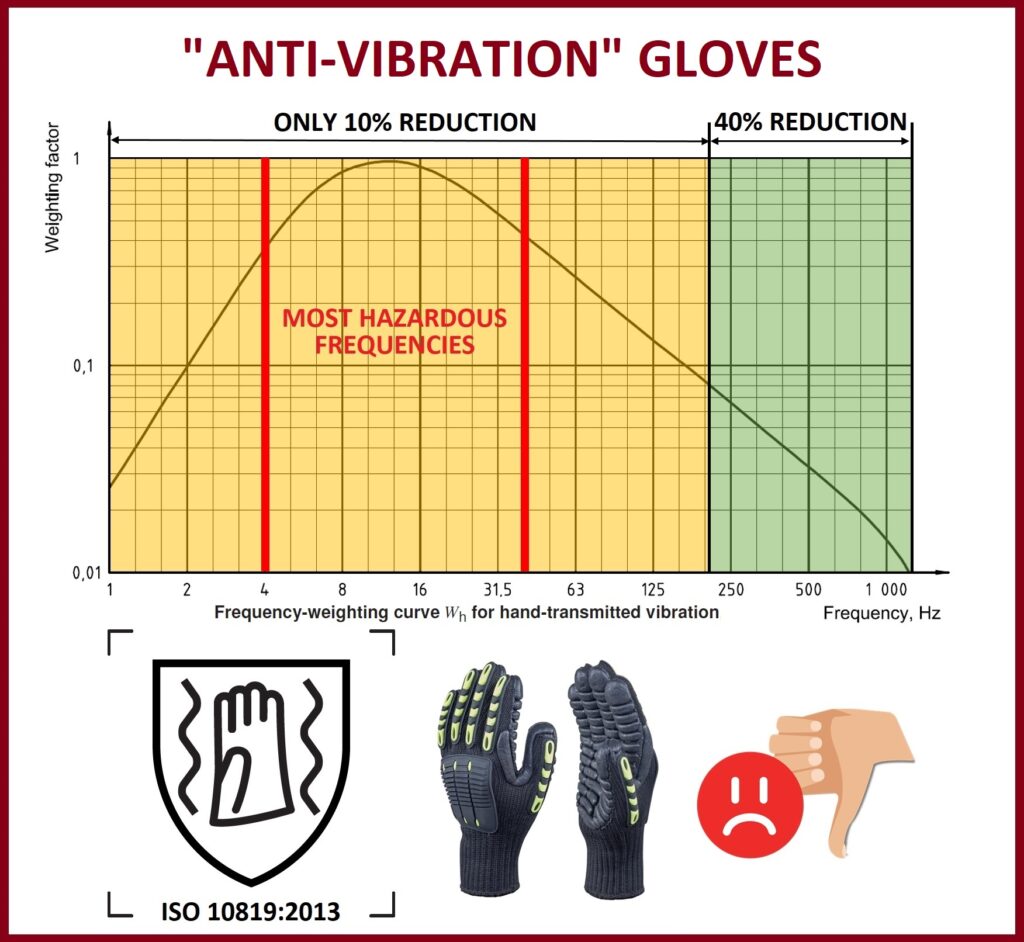
One of the ways to reduce exposure to hand-arm vibration is to reduce the transmitted vibration. Several types of “anti-vibration” gloves are available on the market. These gloves contain a lining of resilient material at the areas of contact (palm and fingers) that is usually a gel, foam, or rubber-like material or an array of air bladders.
Gloves marketed as “anti-vibration” should have been tested and found to meet the requirements of ISO 10819:2013. This standard requires that the vibration transmissibility of the glove is measured over two specified frequency ranges. The tests must show a reduction in the measured vibration by at least 40% in the higher-frequency range (above 200 Hz) and by at least 10% in the lower-frequency range.
Like other mechanical vibration isolators, gloves will generally perform best at the higher frequencies, above a resonance, with little effect at lower frequencies. Gloves can therefore pass the standard test and still produce very small reductions in the frequency-weighted vibration magnitude at the hand. The attenuation requirements are based on the average over a wide range of frequencies. Therefore, some gloves can increase the vibration magnitude in some parts of the frequency range and still meet the requirements of the standard.
Employers should therefore not rely on “anti-vibration” gloves to provide protection against vibration, and it is advisable to use them only where they demonstrably improve the operator’s comfort. Of course, it almost certainly helps to keep the hands (and body) warm and dry, and good-quality industrial gloves, and other clothing, will often have an important part to play.
Source: “Patty’s Industrial Hygiene” 7th ed. p.180-181.
#HAVS #Vibration #IH #OH #Safety #Health
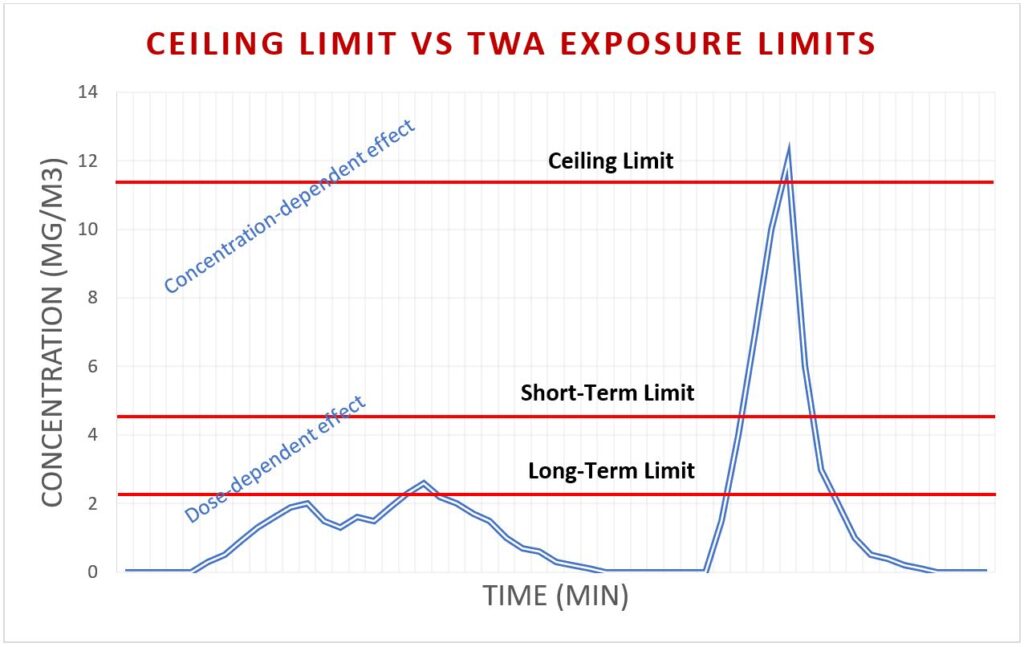
In addition to long-term (8-hour TWA) and short-term (15-min TWA) exposure limits, some authorities derived ceiling limits that are measured instantaneously. The ACGIH defines ceiling limits as the concentration that should not be exceeded during any part of the working exposure.
Ceiling limits are assigned to substances that are concentration-dependent rather than dose-dependent. Concentration-dependent chemicals are defined as fast-acting chemicals whose toxic effects are immediate and correlate more closely to concentration than dose. This category includes sensory irritants and chemicals that are corrosive or vesicant in their action. In contrast, the effects of dose-dependent chemicals are a function of both concentration and duration of exposure, and therefore longer averaging periods are used for dose-dependent exposure limits (15-min, 8-hour or 10-hour TWA).
The ceiling limit is the concentration that should not be exceeded during any part of the working exposure. If instantaneous monitoring is not feasible, then the ceiling shall be assessed as a 15-minute time-weighted average exposure. PID or FID detectors can be used to monitor peak exposures to vapours and gases. For particulates, real-time personal exposure dust monitors like HAZ-DUST 7204 or Respicon TM can be utilised.
Source: “TLVs and BEIs 2019” by ACGIH.
#Health #Safety #Exposure #IH #OH
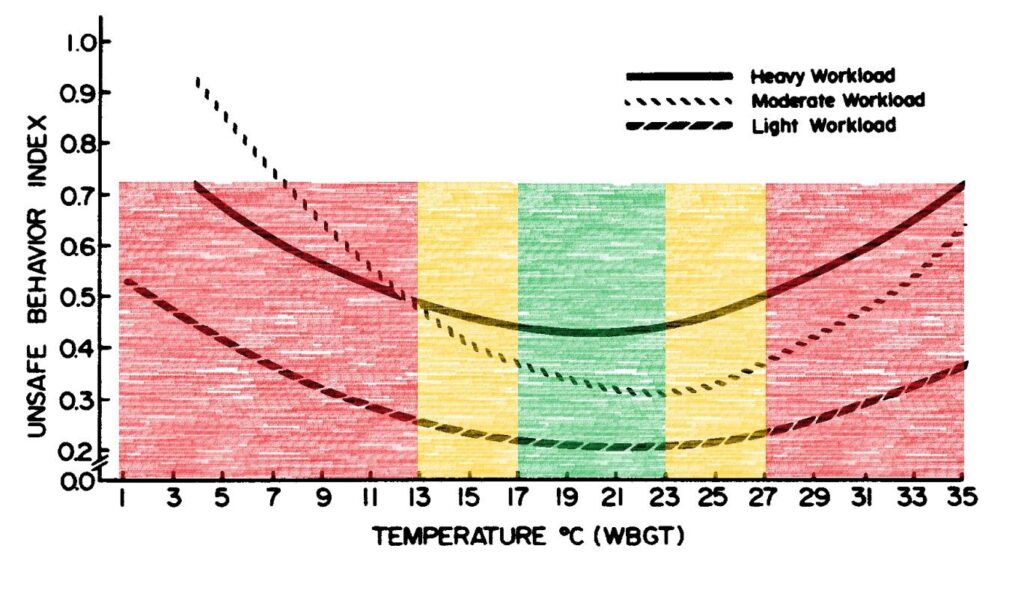
The thermal environment at the workplace can have a direct impact on safe work behaviour. Safe work behaviour will be compromised at very cold and very hot temperatures. This effect was studied in detail by Ramsey et al. (1983), who established that workplace temperature and safe behaviour followed a U-shape relation. It was established that the minimum unsafe behaviour occurred in the preferred temperature zone of 17°C to 23°C wet-bulb globe temperature (WBGT). The unsafe behaviours rate increased when ambient temperatures increased or decreased from this range.
This is an important aspect of a thermal exposure assessment. Hygienists should appreciate that the thermal environment can not only cause physiological stress but also results in psychological effects such as an increased rate of unsafe work behaviour.
Source: Ramsey, J.D., Burford, C.L., Beshir, M.Y. and Jensen, R.C., 1983. Effects of workplace thermal conditions on safe work behavior. Journal of Safety Research, 14(3), pp.105-114.
#Safety #Behaviour #Thermal #Exposure #IH #OH
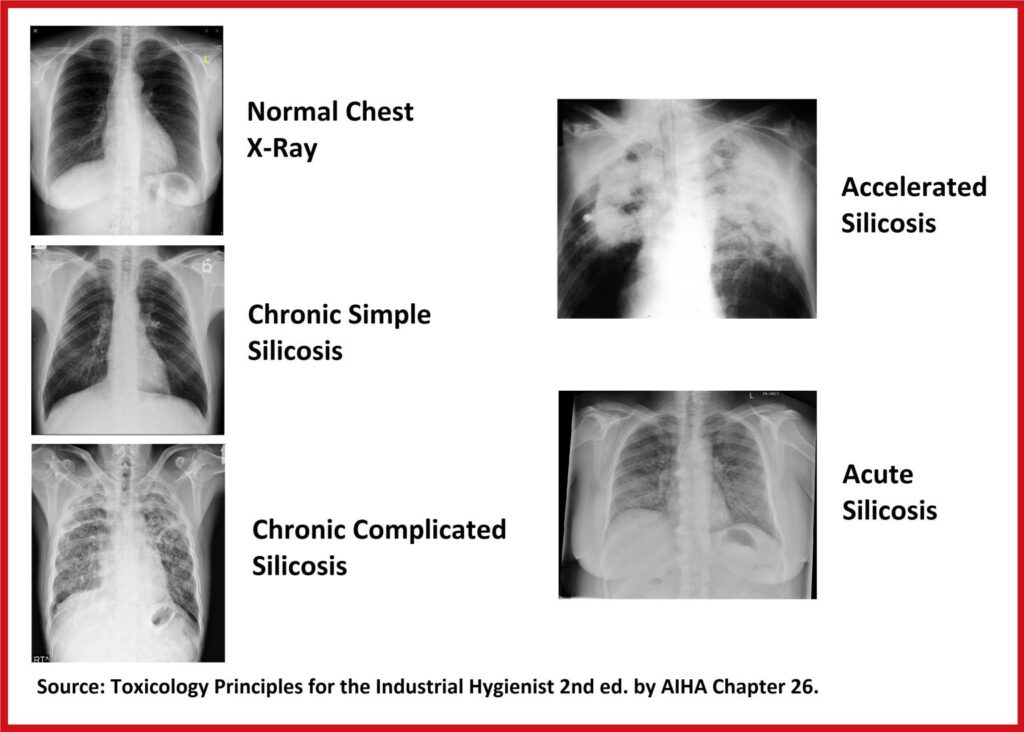
Excessive exposure to respirable crystalline silica (RCS) can lead to the development of silicosis. Silicosis is a fibrotic pulmonary disease caused by the inhalation and retention of RCS. However, not all silicoses are the same.
Chronic Simple Silicosis
The most common type. Results in scarring in the lung after many years (10-30 years) of breathing excessive amounts of RCS. Initially asymptomatic. As it progresses, shortness of breath, dry cough, and reduced pulmonary function can occur.
Chronic Complicated Silicosis
Develops when the small nodules of simple silicosis conglomerate into large lesions. Cell death is observed in the central portion of the lesion. The symptoms are similar to simple silicosis but are more pronounced.
Accelerated Silicosis
Develops in a short period (5-10 years) from exposure to a very high concentration of RCS. It progresses rapidly often resulting in a fatal outcome. Early symptoms of breathlessness quickly progress to hypoxic respiratory failure.
Acute Silicosis
Most destructive type. Caused by exposure to extremely high RCS concentrations. The disease is characterised by pulmonary edema and interstitial inflammation. The symptoms are cough, weight loss and rapid progression to respiratory failure over a few months.
Source: Toxicology Principles for the Industrial Hygienist, 2nd ed. by AIHA, Chapter 26.
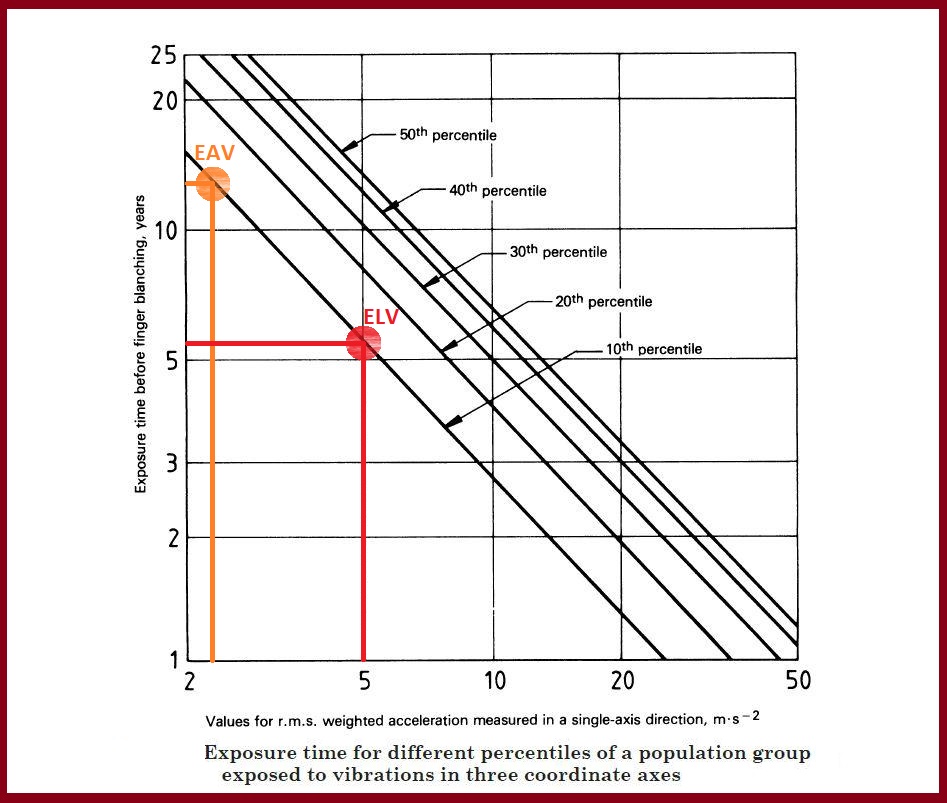
When advising your client on the control of hand-arm vibration at work, it is important to stress that the EU exposure limit value of 5.0 m/s2 is not entirely protective.
The ISO 5349-1 standard presents a chart where the time before the onset of finger blanching (vibration white finger) can be compared with the weighted vibration level for different percentiles of a population.
It can be seen that for 10 years of continuous exposure at the current exposure limit value of 5.0 m/s2, 30% of the exposed population will develop vibration white finger.
Therefore, it is essential to reduce the exposure to hand-arm vibration to at least below the exposure action value of 2.5 m/s2 and preferably as low as reasonably practicable.
#HAVS #Vibration #IH #OH #ISO5349
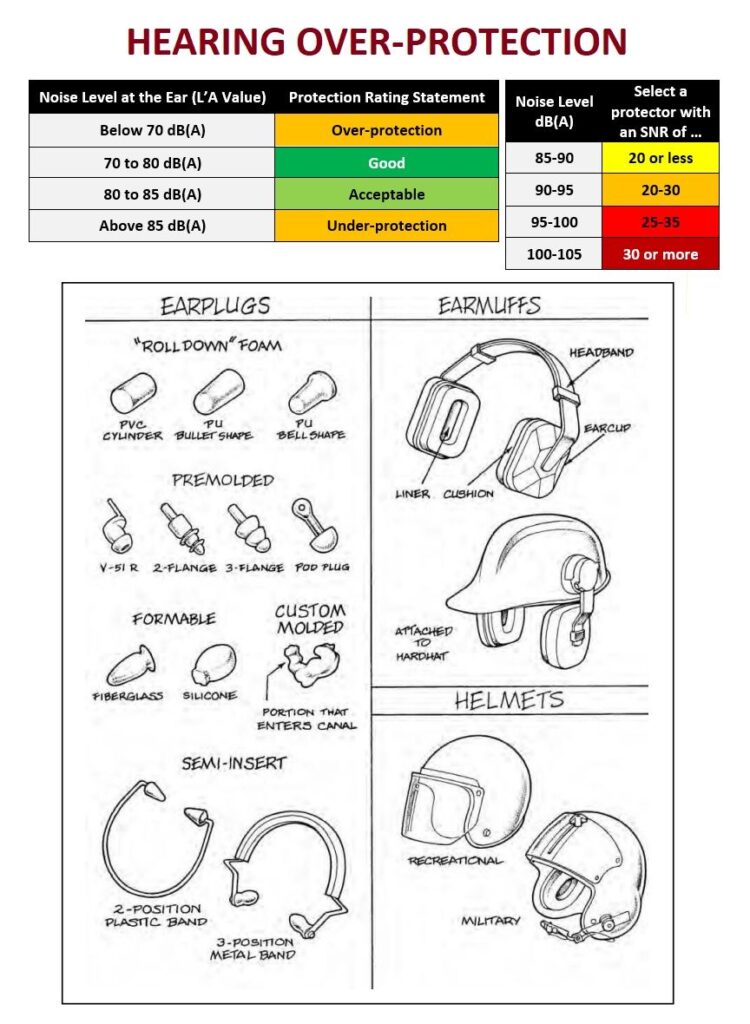
The use of hearing protection devices (HPDs) is the least preferable noise control option but is still essential for many hearing conservation programmes. In order for an HPD to be suitable and sufficient, it needs to reduce the noise levels at the ear to at least below the Exposure Limit Value (ELV) of 87 dBA.
To comply with this requirement, some employers choose HPDs with the highest noise reduction rating (SNR, H-M-L or Octave-band method). Although this is done with a good intention, it can actually have a negative effect.
Hearing over-protection can be detrimental in two ways:
- Reduced audibility of speech and warning signals
- Increased sense of isolation and psychological discomfort
The first detrimental effect can directly result in a serious safety accident, such as being unable to hear a gas alarm or misinterpreting command and starting machinery at the wrong time. The second effect can lead to a wearer removing the HPD more often to relieve discomfort, thus increasing their noise exposure dose.
To avoid that, the UK HSE recommends selecting an HPD with a noise protection rating that will help to achieve the following “noise at the ear” values:
- Below 70 dB(A) – Over-protection
- 70 to 80 dB(A) – Good protection
- 80 to 85 dB(A) – Acceptable protection
- Above 85 dB(A) – Under-protection
By choosing an HPD that will result in noise at the ear values within the preferred range, you will ensure that workers can communicate clearly, hear all the safety alarms, and not experience psychological discomfort.
Source: “The Occupational Environment” by AIHA 3rd ed. p.710
#Noise #Exposure #OH #IH #Health #Safety
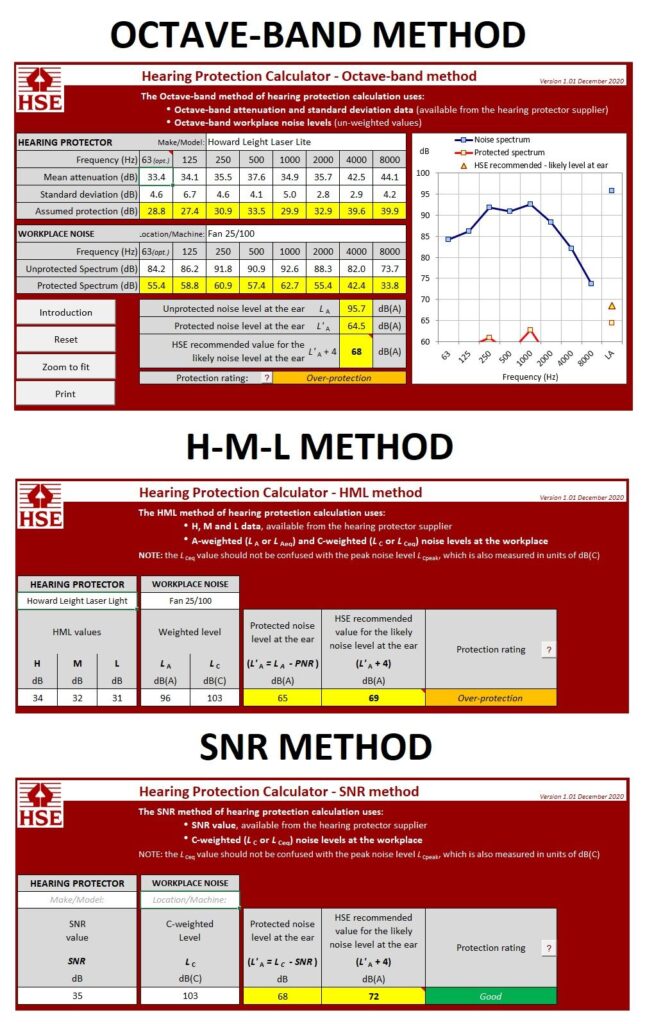
The use of hearing protection devices is one of the key components of a successful hearing conservation programme. Therefore, it is essential to correctly estimate potential noise attenuation provided by a hearing protection device to fulfill your duties under the Control of Noise at Work Regulations 2005.
In the UK, there are 3 prescribed methods to do that:
- Octave-band – Requires detailed data on the frequency content of the noise, and uses information on the attenuation of the protector at specified frequencies. This is the most accurate method to estimate attenuation but requires more data, such as the octave-band spectrum.
- HML – Three values H, M and L are used with two simple measurements of the sound pressure level. This is a simpler method to estimate evaluation that requires A-weighted and C-weighted average sound pressure levels.
- SNR – The simplest method of assessment that only requires a C-weighted average sound pressure level.
Approved Code of Practice L108 describes in great detail the calculations involved in these methods; however, the UK HSE has created an online calculator that is much easier and quicker to use.
Source: ACOP L108 p.103.
When assessing psychosocial risk factors at work occupational hygienists should pay close attention to background noise. A conceptual performance-arousal curve presented by Hebb (1949) shows how too little or too much of noise can affect work performance.
Optimal performance occurs when mental stimulation is around the top of the curve. The performance is likely to be impaired both at low levels of stimulation (dull, monotonous work), and at over-high levels of stimulation, where demands are excessive.
In terms of noise levels, dull, monotonous work may benefit from the addition of noise, as this increases stimulation towards the top of the curve. This explains the popularity of music as a background on routine production lines.
Conversely, when work is already demanding, the introduction of further stimulation is likely to increase those demands beyond the top of the curve and thus impair performance.
This is particularly the case when noise contains meaning (e.g. conversation), rather than consisting of neutral ‘white noise’ such as may be generated by machinery. Noise with meaning creates a need for additional mental processing to screen out irrelevant information.
Source: “Occupational Hygiene” 3rd ed. by K. Gardiner p. 365

It is a well-established fact that high levels of noise can result in noise-induced hearing loss. However, noise cannot be completely eliminated in the industrial environment. We have to make a socioeconomic compromise to balance the benefits of noisy operations against the negative health effects.
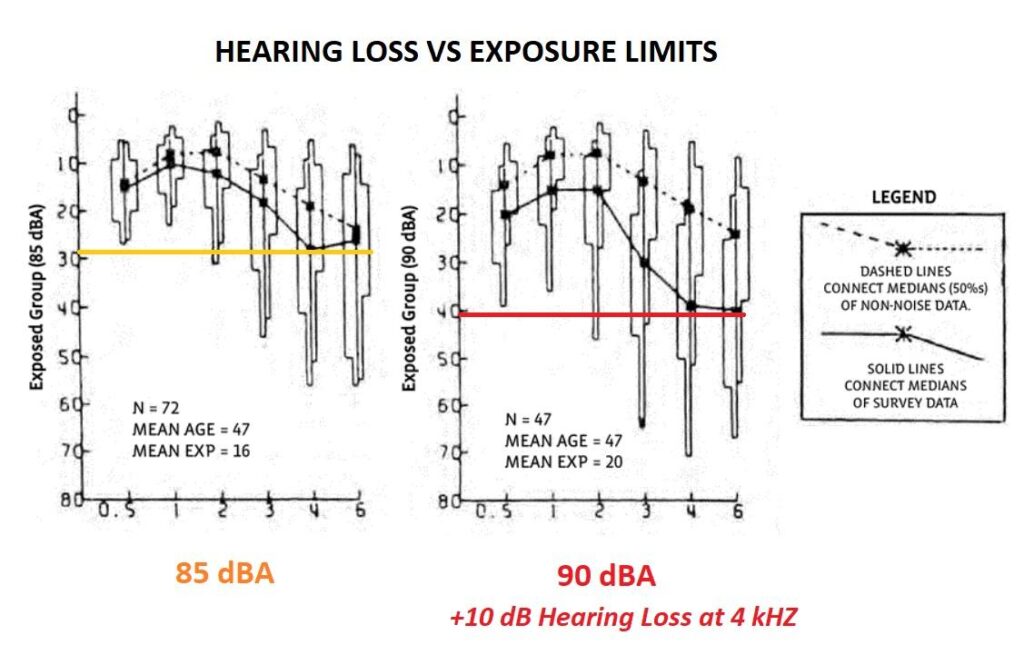
The question is at what level we make that compromise? NIOSH published research in 1974 comparing the levels of hearing of groups of workers exposed to different levels of noise for extended periods of time.
The results were clear; the higher the level of noise, the greater is the damage to the hearing system. For comparison, a 90 dBA median exposure for 20 years resulted in a 40 dB hearing loss at 4 kHZ. This was 10 dB more than for a group of workers exposed to 85 dBA median exposure for 16 years.
The dotted line indicates the hearing levels of the same age population without noise exposure. It can be seen that the best socioeconomic balance is achieved at the noise exposure limit of 85 dBA where lifetime exposure can result in only mild hearing loss. In practice, all exposures to noise should be kept below the 80 dBA mark.
Source: NIOSH Occupational Noise and Hearing: 1968–1972 (NIOSH Pub. No. 74-116).
The fundamental paradigm of toxicology, “the dose makes it a poison,” is equally applicable to noise exposure. The best way to prevent noise-induced hearing loss (NIHL) is to eliminate the noise or to reduce exposure to a level below the threshold of adverse effect. Such threshold can be assumed at 80 dBA (8-hour TWA), where the excess risk of hearing loss is not evident.
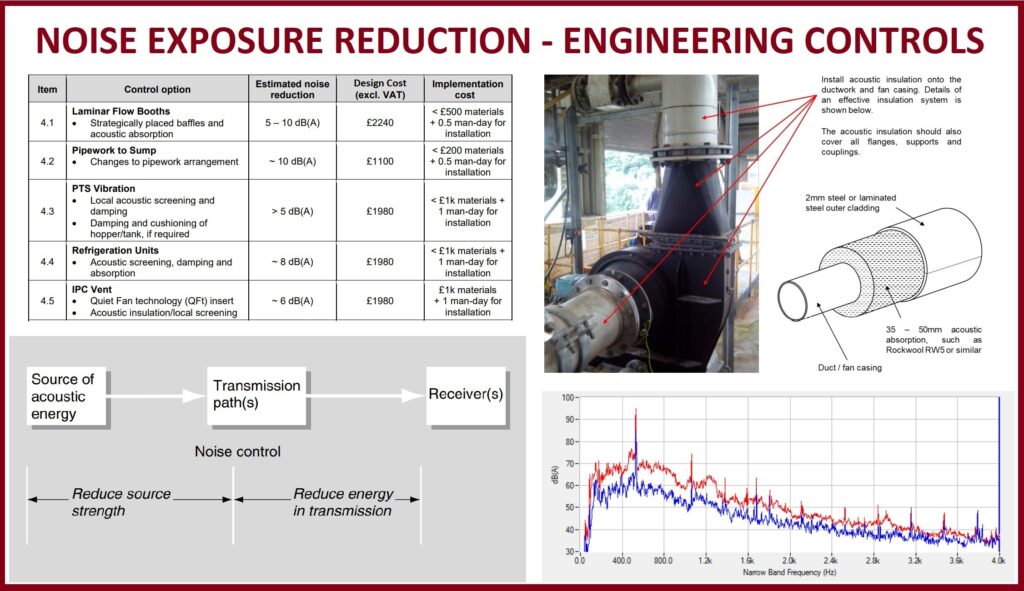
The exposure to noise is best reduced through engineering controls since individual hearing protection devices are prone to misuse rendering them ineffective. In the UK, it is a legal requirement to implement a programme of technical and administrative controls when daily exposure levels exceed 85 dBA.
Noise controls can be broadly divided into three groups:
· Noise reduction at source (reduction of source strength)
· Control of transmission path (reduction of energy in transmission)
· Control of noise exposure for the receiver (hearing protection devices)
Designing adequate noise controls is a complex issue requiring specialised knowledge of acoustics. The competency of an Occupational Hygienist is unlikely to be sufficient to design and implement effective noise solutions. It is common to purchase expensive and ineffective generic noise control solutions leading to waste of resources and minimal risk reduction. As such, it is essential to contract a qualified Acoustician to undertake a Noise Control Audit.
During the Noise Control Audit, the acoustics specialist examines the dominant sources of noise identified from your previous noise surveys. They undertake the octave band analysis on each noisy piece of equipment to understand the route cause of the noise. At the end, you are presented with a cost-benefit analysis informing you of potential noise reduction vs the cost of design and implementation.
Acosutics specialist will then undertake a more detailed analysis of those machinery and equipment selected for the noise reduction. A final report will present technical drawings and material specifications that will allow you to contract a local fabrication company that can manufacture and install the specified engineering solutions.
Such an approach ensures that the right competence is utilised at the right stage of a hearing conservavtion programme to ensure efficient risk reduction to workers’ health with minimal waste of resources.
#Noise #Safety #Control #IH #OH #Health #Hearing
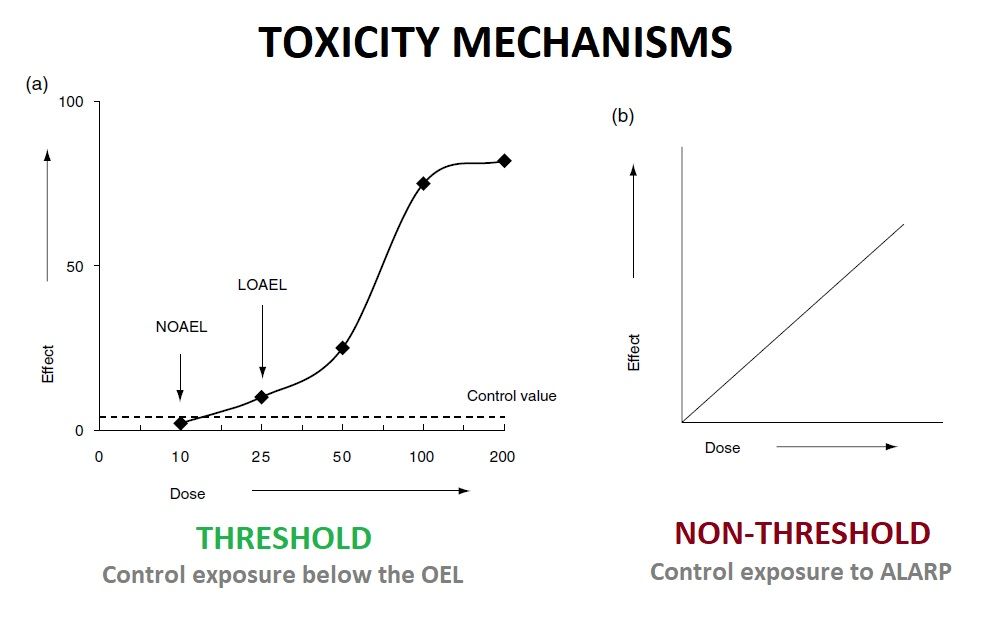
Carcinogenicity (genotoxicity) is conventionally treated as a “non-threshold phenomenon”. This means that any exposure, no matter how small, is regarded as conferring some degree of risk in terms of eliciting a genotoxic change. The idea is that any molecule of the genotoxic agent could produce one crucial change in the DNA programme, thus catalysing a series of catastrophic changes, e.g. cancer development.
In reality, there are physiological defence mechanisms that can “detoxify” molecules of genotoxicants before they can attack DNA, and there are also DNA repair mechanisms that can restore back to normal sites of DNA damage. These observations suggest that there may be practical dose thresholds for genotoxicity to be expressed.
However, limitations in the sensitivity of the test methods available mean that it is not possible to determine reliable dose thresholds for the development of genotoxic effects.
The regulatory response to identified genotoxicants is to treat them in a manner commensurate with no reliable threshold dose for the effect being identifiable. Therefore, COSHH 2002 Regulations dictate to reduce all exposures to carcinogens to as low level as reasonably practicable (ALARP) and not just below the WEL.
#OH #IH #Safety
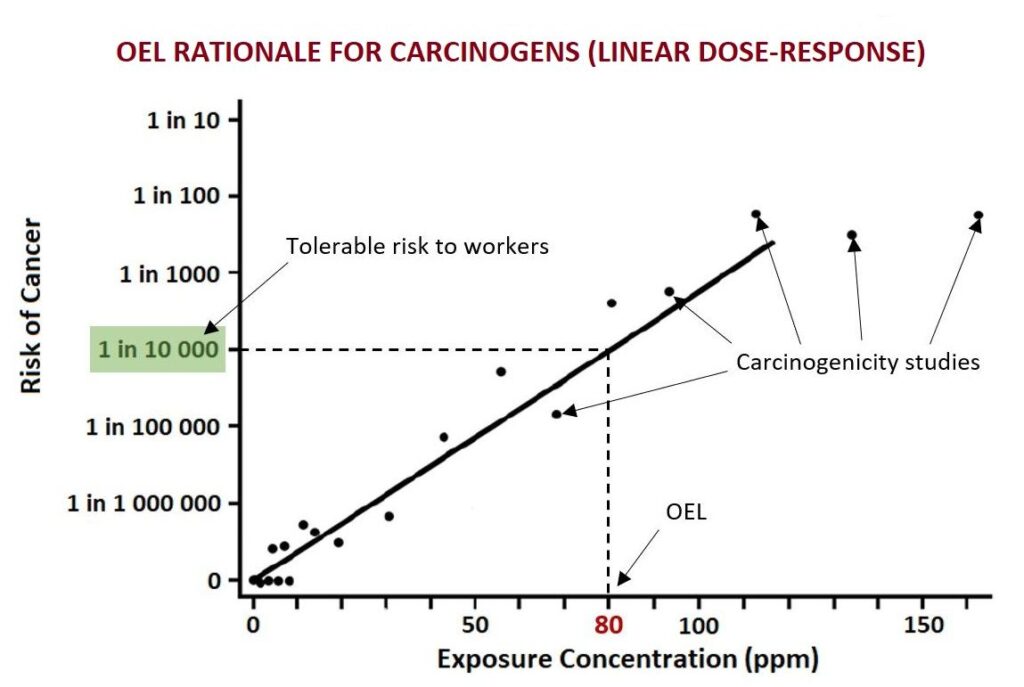
Setting an occupational exposure limit for a carcinogenic substance is complicated since there is no safe threshold for exposure to carcinogens. Any exposure to a carcinogen above hypothetical zero increases the risk of cancer to some extent. Therefore, the only exposure level at which there will be no adverse health effect (increased risk of cancer) is zero.
However, to regulate exposure to carcinogens, it is necessary to have legally binding OELs that are somewhat protective depending on the risk tolerance of an OEL setting agency. The level of risk is usually dictated by the society through elected representatives who then convey the public views into legislation. In the UK, the acceptable risk to workers is somewhere between 1 in 1000 and 1 in 10 000.
In a nutshell, to set an OEL for a carcinogen, a number of relevant exposure studies (typically animal toxicity data) are pulled together and plotted onto a chart. A best-fit line is then drawn through the data points and the hypothetical zero. The selected risk tolerance level is then matched with the exposure concentration, which becomes an OEL.
An OEL for a carcinogen does not protect you against cancer as such but protects you against the intolerable risk of cancer. Therefore, it is crucial to reduce exposures to carcinogens below the OEL AND as low as reasonably practicable (ALARP).
Source: Patty’s Industrial Hygiene 6th ed. p709.
#OH #IH #Exposure #Safety #OEL #Cancer
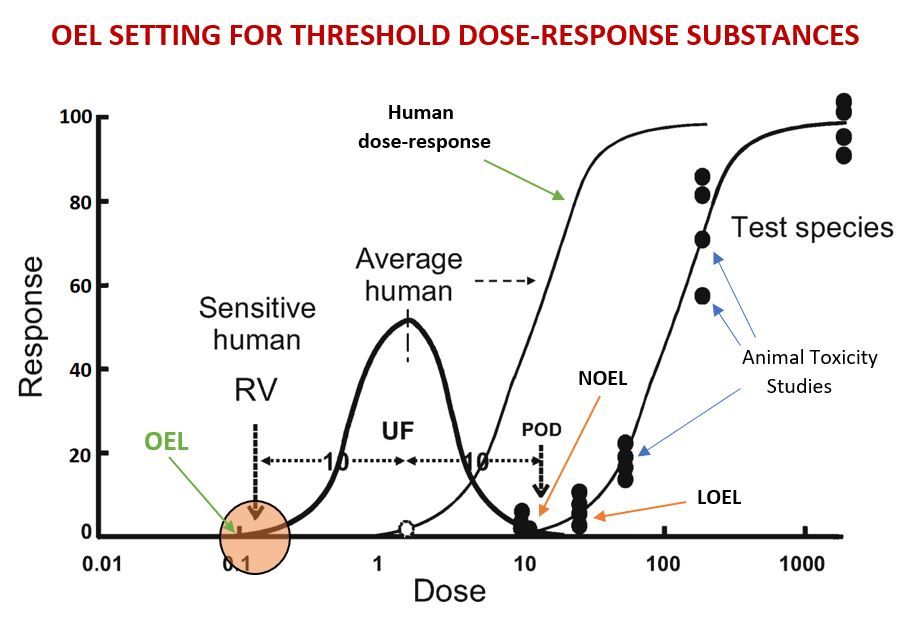
Where a substance is thought to exhibit a threshold in its dose-response curve, it becomes possible to derive an occupational exposure limit (OEL) that can protect most workers from adverse health effects without the need to reduce exposures to as low a level as reasonably practicable (ALARP). Simply controlling exposure to below this limit may be fully protective.
To derive an OEL for a substance that is believed to exhibit threshold toxicity mechanism, a number of animal toxicity data is pulled together to plot an exact dose-response curve that is often of a sigmoid pattern. A study with the Lowest Observed Effect Level (LOEL) or a No Observable Effect Level (NOEL) is typically selected as a Point of Departure (POD).
To extrapolate the dose-response curve derived from the animal toxicity data, an uncertainty factor (UF) for inter-species variability is applied (usually a 10-fold). Following the application of this UF, the dose-response curve is shifted to the left (response at a lower concentration) that provides some degree of conservatism.
Within the human population, there will be a range of sensitivities, reflected by a distribution of PODs (Gaussian curve). The factor for inter-individual sensitivity is used to determine the POD in a sensitive subject, which will lie towards the far left of the distribution curve. This POD has been termed a reference value (RV).
A number of additional UFs can be applied to this RV depending on the quality and completeness of original toxicological data. If this is required, the reference value is multiplied by additional UFs, and the resultant number becomes an OEL.
Source: Application of Key Events Analysis to Chemical Carcinogens and Noncarcinogens (Boobis et al. 2009)
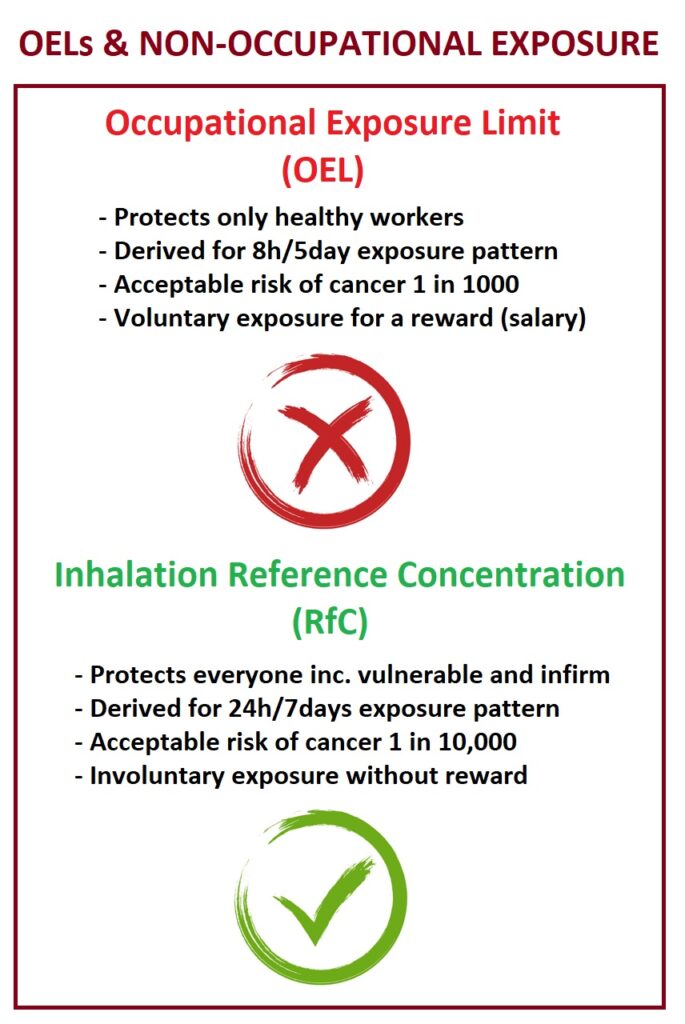
Occupational exposure limits (OELs) are typically derived so that a worker can be exposed to a specific concentration of a chemical over the working lifetime without experiencing any adverse health effects or unacceptable excess risk of cancer.
When considering exposure in non-occupational settings, you should never use OELs to complete your health risk assessment. There are several reasons not to apply OELs to the general public:
- Occupational exposures typically occur 8 hours per day, 5 days a week, over 50 weeks per year or less, while non-occupational exposures can be 24/7 all year.
- Occupationally exposed workers are generally in the prime of life and more healthy, while non-occupationally exposed folks can be very young, very old, infirmed or shut in.
- The UK HSE sets the acceptable risk of dying on the job about 1 in 1000, while for the general public, it is set at 1 in 10,000 a year.
- Occupationally exposed persons are being compensated (i.e., paid) during their exposure, while non-occupationally exposed folks are presumably not deriving any benefit from their exposure.
Thus, the exposure limits for non-occupationally exposed persons are always lower than for those who are occupationally exposed. If you have to carry out exposure assessment for non-occupationally exposed groups, you could use Inhalation Reference Concentrations (RfCs) derived by the US EPA as the benchmark of acceptability. You would also need to reconsider sample collection and analysis methods to achieve a better limit of detection, often 1000 times lower than required for an OEL.
Source: Patty’s Industrial Hygiene 6th ed. p.768-770.
#Exposure #Health #Safety #IH #OH #OEL
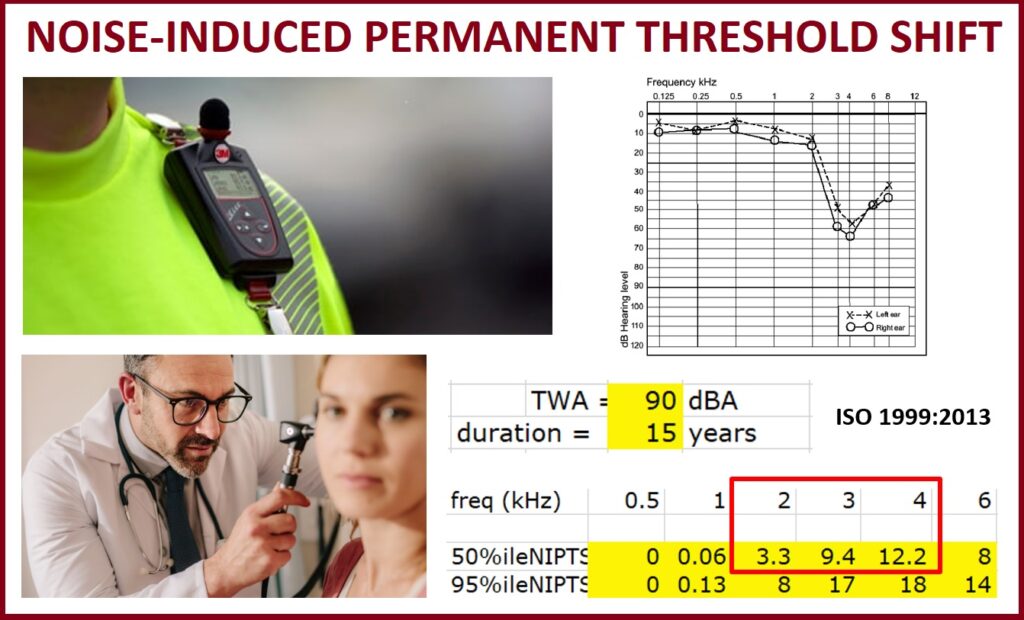
When audiometric testing highlights a significant permanent threshold shift (PTS), the exposed individual is referred to an Occupational Physician for diagnosing the nature of the hearing loss. An Occupational Physician will typically question if the employee is exposed to loud noise at work and the noise-induced hearing loss (NIHL) diagnosis may be confirmed or rejected based solely on this information. This qualitative approach is very subjective and is prone to bias. A person routinely exposed to 87dBA (Lep,d) may not perceive the environment as noisy, although it will be damaging to his/her hearing.
To assist in diagnosing NIHL, an Occupational Hygienist should supply the diagnosing Physician with quantitative data such as the noise exposure level (dBA Lep,d) and the duration (years) of exposure. Once this data is obtained, the Physician could utilise the ISO 1999:2013 standard to estimate the noise-induced permanent threshold shift (NIPTS).
NIPTS allows you to quantify the amount of hearing loss attributed to noise exposure while accounting for the natural decrease in hearing due to age. For example, if a Physician is presented with a hearing loss case and the Occupational Hygienist provides exposure data that suggest a daily exposure level of 90 dBA (Lep,d) for 15 years, then the mean average hearing loss due to noise in 2, 3 and 4 kHz will be estimated at 8.3 dB.
ISO 1999:2013 method can only precisely quantify the predicted NIPTS for large noise-exposed populations. However, in doubtful individual cases, the data may provide an additional means for estimating the most probable causes in audiological diagnosis.
Source: ISO 1999:2013 Estimation of noise-induced hearing loss.
#IH #OH #Noise #Exposure #Health #Safety #Hearing
Noise-induced permanent threshold shift calculator:
https://www.hearingconservation.org/assets/NIPTS%20Calculator.xls
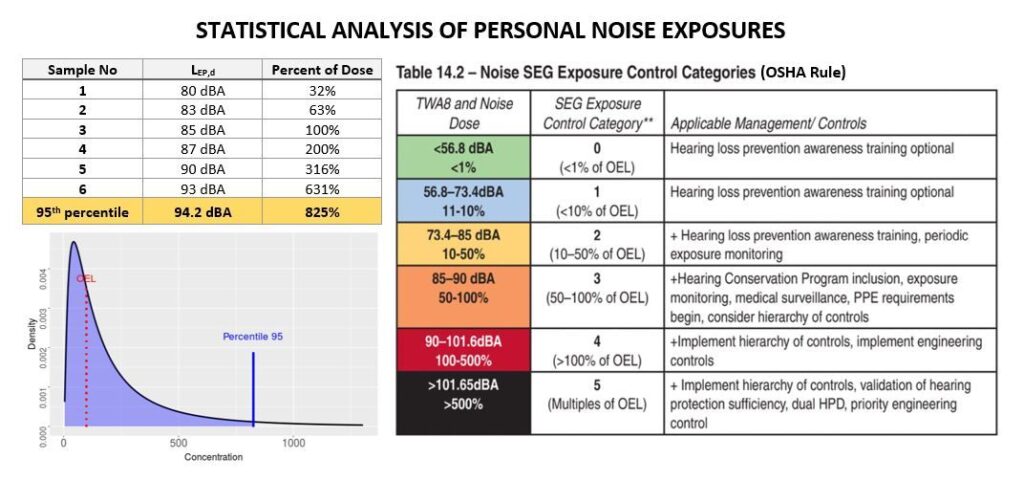
Did you know that you can calculate the exposure distribution and the 95th percentile for personal noise exposures similar to statistical analysis used for chemical exposures?
According to AIHA, Bayesian analysis software used to address airborne contaminants can also be used for noise exposures. Similar to airborne exposures, noise exposures are also log-normally distributed when expressed as a percent of dose. Given that Lep,d values are normally distributed, as they are based on a logarithmic scale, they must be converted to percent dose before Bayesian analysis can be performed.
Combining your findings from the qualitative assessment together with the quantitative findings can lead to reliable overall decisions. IHDA software can be used for this purpose.
Although not described in the AIHA exposure assessment book, the same principles are likely to apply to hand-arm vibration exposure due to similarities with noise. Again it is very important to convert any TWA values into percent of dose.
Source: “A Strategy for Assessing and Managing Occupational Exposures” 4th Edition by AIHA, p.198.
#noise #exposure #statistics #IH #OH #AIHA #Safety
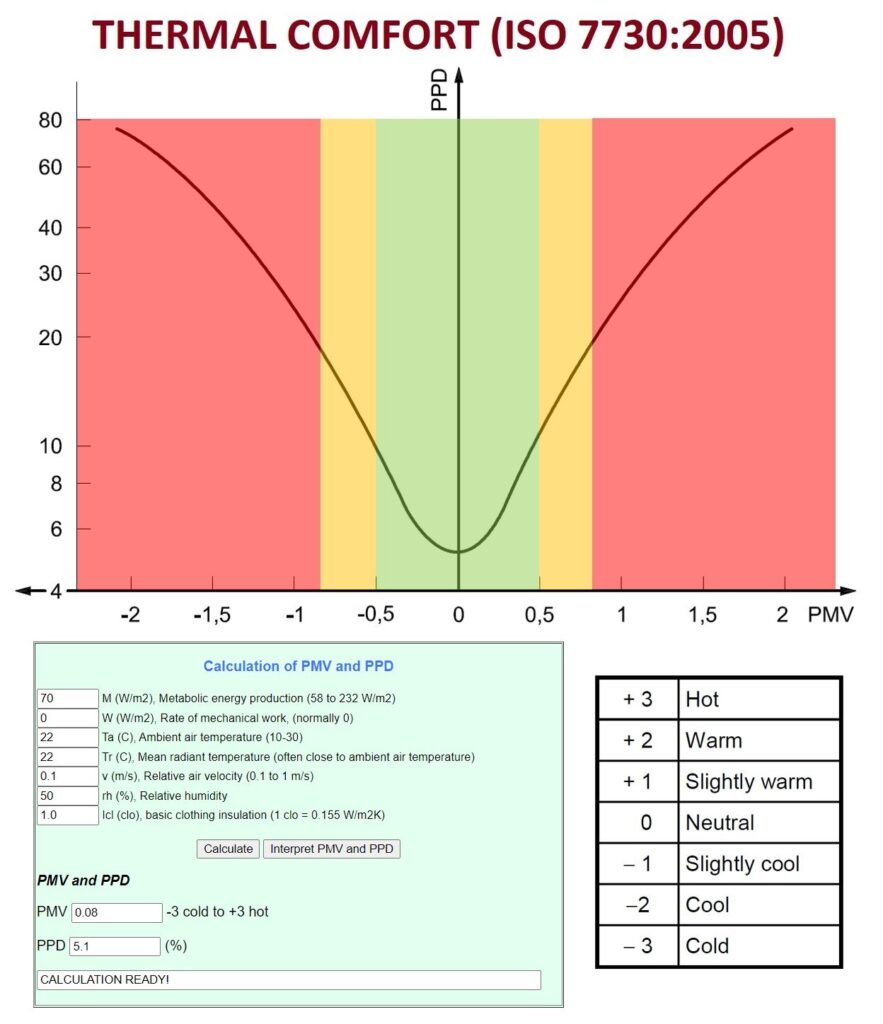
Thermal comfort is a subjective perception of the surrounding environment influenced by the level of physical activity (W/m2) and clothing (clo), as well as the environmental parameters such as air temperature (°Ca), mean radiant temperature (°Cr), air velocity (m/s) and air humidity (RH%).
When these factors have been estimated or measured, the thermal sensation for the body as a whole can be predicted by calculating the predicted mean vote (PMV). Thermal comfort is different to thermal stress as it is not considered to have serious adverse health effects but instead produce discomfort leading to complaints and loss of productivity.
Once the PMV is calculated, the predicted percentage dissatisfied (PPD) can be determined. The ideal PMV score is 0, leading to only 5% of occupants being dissatisfied. This, however, is very difficult to achieve, and a more realistic PPD of <15% is often adopted. The nature of the building dictates the desired level of comfort.
For example, spaces occupied by very sensitive and fragile persons with special requirements (e.g. kindergarten, retirement home) should have –0.2 < PMV < 0.2 resulting in PPD <6%. On the other hand, the existing building used by mostly healthy population (e.g. department store) can have –0.7 < PMV < 0.7 resulting in PPD <15%.
Occupational Hygienists are often asked to assess the indoor air quality or a “sick building” syndrome. The ISO 7730:2005 standard can equip you with a tool to evaluate built environments and advise on the best course of action to reduce the number of dissatisfied employees. An online calculator designed by Chuansi Gao will help you complete calculations and predict how the change in environmental parameters will affect the PPD.
PMV and PPD Calculator https://www.eat.lth.se/fileadmin/eat/Termisk_miljoe/PMV-PPD.html
Source: ISO 7730:2005 “Ergonomics of the thermal environment”.
#Thermal #Comfort #ISO7730 #OH #IH #Health #Safety
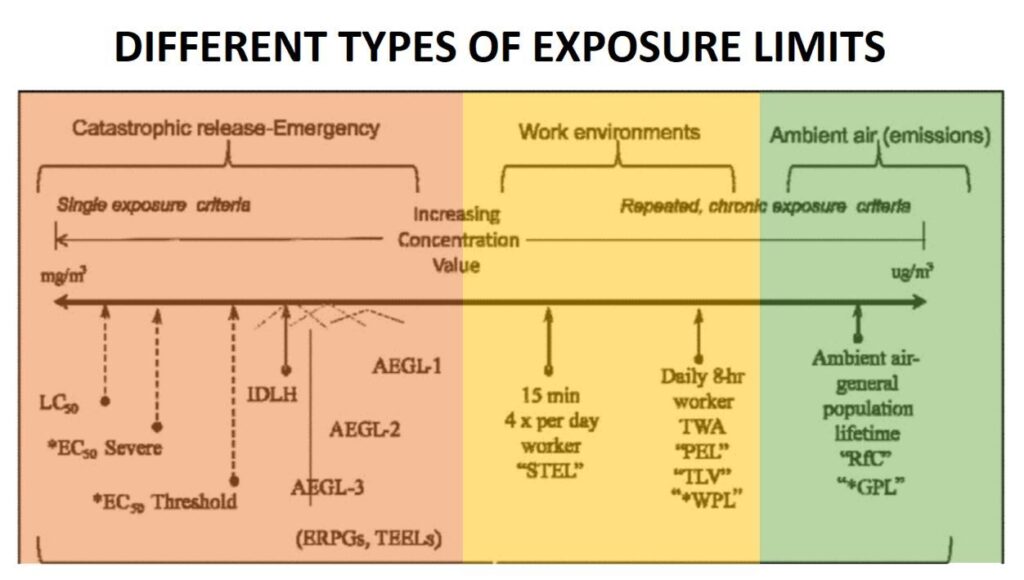
All practicing hygienists are well versed in statutory occupational exposure limits. However, there are other types of exposure limits that hygienists should be aware of that are applicable in non-standard situations.
LC50 — Lethal Concentration 50%, concentration fatal to ½ of exposed group
*EC50 — Effective Concentration 50%, for severe or mild/threshold effects.
IDLH — Immediately Dangerous to Life or Health, occupational use, 30-minute standard used as criteria for donning full protective gear.
AEGL — Acute Exposure Guidelines Level – for civilian emergencies.
ERPG — Emergency Response Planning Guideline – air concentration guidelines for single exposures to agents.
TEEL — Temporary Emergency Exposure Level, chemical exposure guidelines to use for emergency planning (if no AEGL or ERPG is available).
*WPL — Worker Population Limit, military, used for chemical warfare agents, represents standards similar to TLV.
RfC — Reference Concentration, estimated concentration that could be breathed continuously every day for a lifetime without adverse effects.
*GPL — General Population Limit, term used for chronic protection levels developed for Army for chemical warfare agents.
Source: “The Occupational Environment” 3rd ed. by AIHA, p.186.
#IH #OH
Legionella bacteria are the causative agents of Legionnaires’ disease, a potentially fatal pneumonia, and Pontiac fever, a milder self-limiting illness. These bacteria are ubiquitous in an aqueous environment but favour growth in man-made water systems that see water stagnation and operating temperatures between 20 °C and 45 °C. The uncontrolled growth of Legionella bacteria leads to water contamination. Some water systems, such as domestic showers, may generate airborne water droplets (aerosol) contaminated with these bacteria. It is the inhalation of these contaminated droplets that may lead to potentially life-threatening lung disease.
One such water system capable of generating aerosol is a domestic shower. The shower is the most frequently used aerosol-generating device in household settings. The environment within this water system favours the growth of the bacteria due to warm water temperatures. Depending on the hygiene habits, the shower may not be used frequently, adding another risk factor of water stagnation. With the aging population, the share of immunocompromised occupants susceptible to Legionnaire’s disease is increasing. All of these factors highlight the importance of having preventative measures in place to control the growth of Legionella bacteria in domestic water systems and showers in particular.
A study by Collins et al. (2016) investigated the occurrence of Legionella in UK household showers. Ninety-nine showers from 82 separate properties in the South of England were sampled. The study has demonstrated that UK domestic showers are frequently positive for non-pneumophila Legionella. 48% of UK households included in this study were found to be contaminated with the bacteria. Although 48% may seem alarming, the identified Legionella species were non-pneumophila. Non-pneumophila species are believed to be implicated in only 10% of all Legionella infection cases (Muder & Yu, 2002). The majority of confirmed infections involving non-pneumophila Legionella species have occurred in immunosuppressed patients.
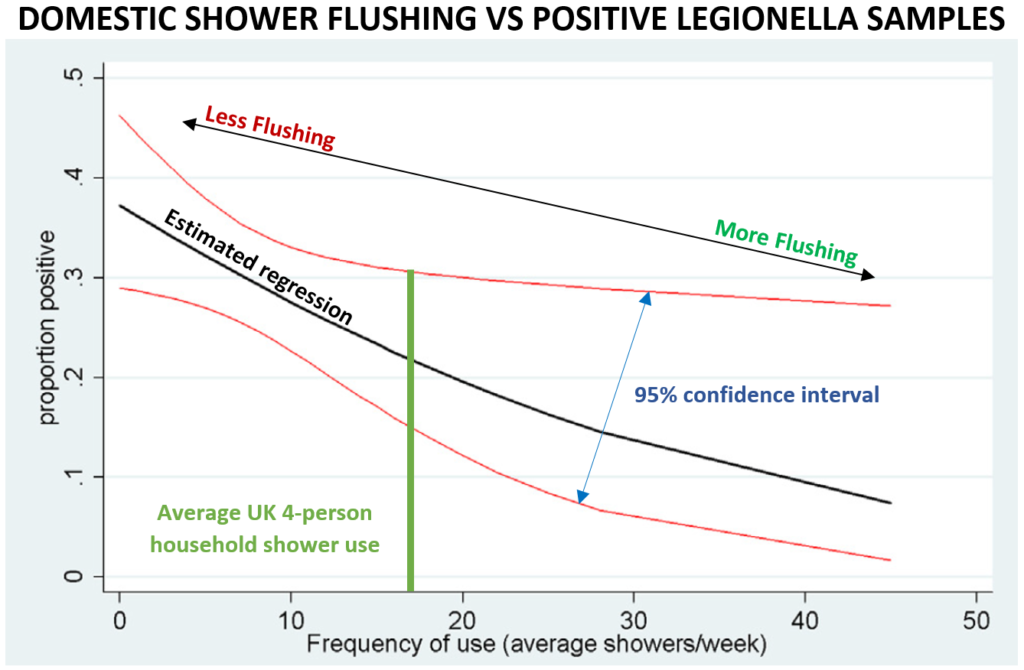
There was a negative correlation between the frequency of shower use and the proportion of positive samples (Collins et al., 2016). This demonstrates that more frequent flushing of the water systems reduces the potential for bacteria growth. Another correlation was established between the age of the shower head and the number of positive samples. Only 10.5% of showers <2 years of age were positive for Legionella, while 56% of showers >10 years old were contaminated with the bacteria. There was an estimated 43% increase in positive samples for a doubling of shower age. To control this risk factor, periodic cleaning and disinfection of the shower head should be carried out to prevent the colonisation of the water system outlet. Replacing the entire shower head and the hose every 5 years may also be beneficial.
Apart from domestic water systems, Legionella can be found in many industrial settings, such as cooling towers, adiabatic chillers, air conditioning units, and emergency showers, as well as leisure water systems such as pools and SPA. The control of bacteria in these water systems will follow the same principles of controlling the temperature outside the 20°C and 45°C range, preventing water stagnation through flushing and water circulation and system cleaning and disinfection. However, additional measures, such as chemical dosing to eliminate bacterial growth and to avoid limescale build-up, can be introduced for complex water systems.
The Control of Substances Hazardous to Health (2002) Regulations do not discriminate between the types of Legionella bacteria. In the eyes of the law, the same risk management measures must be applied to both pneumophila and non-pneumophila Legionella species. This includes the risk assessment, use and maintenance of control measures, exposure monitoring, and health surveillance. At TransAtlantic safety, we can help you to manage your water systems… etc. etc.
References:
Collins, S. et al. (2017) “Occurrence of Legionella in UK household showers,” International Journal of Hygiene and Environmental Health, 220(2), pp. 401–406. Available at: https://doi.org/https://doi.org/10.1016/j.ijheh.2016.12.001.
Muder, R.R. and Yu, V.L. (2002) “Infection Due to Legionella Species Other Than L. pneumophila,” Clinical Infectious Diseases, 35(8), pp. 990–998. Available at: https://doi.org/https://doi.org/10.1086/342884.
Sellwood, P. (2013) at home with water. publication. London: Energy Saving Trust, p. 8.
Let’s progress your business together
Speak to one of our experts


